8th R/Rmetrics Workshop and Summer School, Paris, 27 June 2014
A 3 days workshop in finance with the R software
I presented for the first time in public the recently discovered power hyperbolas and Kiener distributions at the 8th R/Rmetrics Workshop and Summer School that took place on 26-28 June 2014 in the historical Couvent des Bernardins in Paris. The presentation covers the theoretical asects and introduces the R package FatTailsR.
A few open questions are listed in the conclusion. If you have any ideas and wish to share your solution, please contact me. You can download my presentation from here:
Here is the French version:
9th R/Rmetrics Summer Workshop 2015, Zurich, 27 June 2015
A 3 days workshop in finance with the R software
For this second presentation, I gave more details on Kiener distributions and their applications in finance at the 9th R/Rmetrics Summer Workshop 2015 that took place on 25-27 June 2015 in the beautiful Villa Hatt (which belongs to ETHZ) in Zurich.
You can download my presentation from here:
An introduction to the R package FatTailsR
FatTailsR: a R package for Kiener distributions and fat tails in finance
This package (version 1.7-5 issued on 18 June 2015) is dedicated to:
Kiener distributions of type I, II, III and IV.
Two different methods and three functions to estimate the distribution parameters.
Power hyperbolas, powerhyperbolic functions and their inverses,
It can be found on CRAN and on its various mirrors at the following address:
The reference manual is available on CRAN and here.
The figures (without the data and tables) of the various examples provided in the documentation are summarised here.
A few examples and the help files are available here.
Kiener distributions are excellent tools to describe the returns of stocks, indices, commodities, currencies, futures, options and warrants publicly listed. The left and right fat tails of those distributions are perfectly described. Therefore, quantiles and value-at-risk can be properly estimated. Applications encompass risk measurement (Solvency II, Bâle III), portfolio management, stochastic processes and derivatives pricing.
Kiener distributions are built on power hyperbolas which are intermediate models between the hyperbola on one side and the exponential on the other side. They use the median as the pivotal value between left and right tails.
Power hyperbolic functions are also built on power hyperbolas. They look similar to but extend cosh, sinh, tanh functions and their inverses.
A good introduction to the functions and models exposed in the package can be found in the presentation made at the 8th R/Rmetrics Workshop and Summer School on 27 June 2014 (see above).
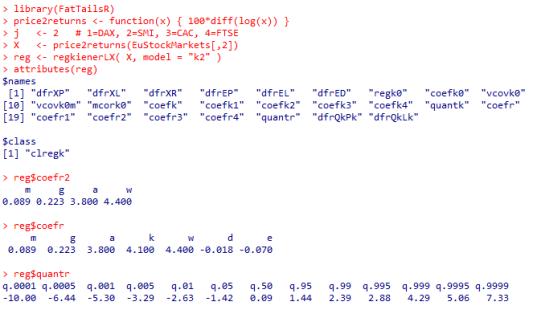
Within one function, regkienerLX, a dataset X is fully described with 3 parameters (symmetric model) or 4 parameters (asymmetric model) among :
symmetric model "K1" : (m, g, k) and (a=k=w, d=e=0)
asymmetric model "K2" : (m, g, a, w)
asymmetric model "K3" : (m, g, k, d)
asymmetric model "K4" : (m, g, k, e)
where :
m (mu) is the median
g (gamma) is the scale parameter, different from the standard deviation
a (alpha) is the left tail parameter, a Pareto and Karamata exponent
k (kappa) is a global tail parameter, the harmonic mean of a and w
w (omega) is the right tail parameter, a Pareto and Karamata exponent
d (delta) is the distorsion parameter, when a is different from w
e (epsilon) is the eccentricity parameter, when a is different from w.
e = d / k
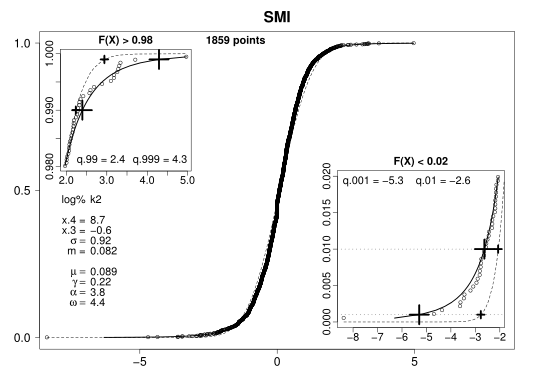
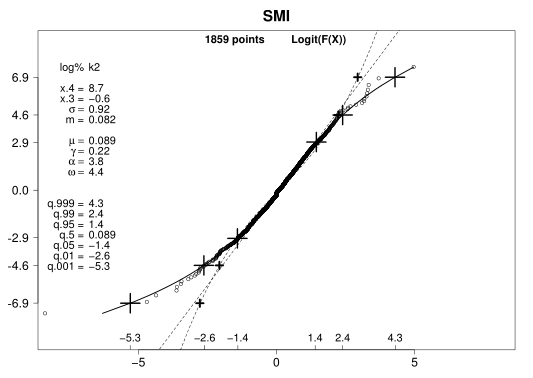
The figures below are for the Swiss Market Index during the period 1991 - 1998, a dataset available in all releases of R. The skewness x.3 = -0.6, the kurtosis x.4 = 8.7, the tail indexes a = 3.8 and w = 4.4 and the eccentricity e = - 7 % describe an asymmetric fat-tailed distribution very different from the Laplace-Gauss normal distribution. The extreme log-return -8.38 % modifies the curvature of the left tail and increases the risk of losses.
The large plus on the full line are the quantiles calculated with the model "K2" and the small plus on the dashed line are the quantiles calculated with the Laplace-Gauss normal distribution. The difference appears in a clear way in the Q-L plot or quantiles-Logit plot where the y-axis represents the logit of the probabilites logit(p) = log(p/(1-p)).
The excessive use of the inappropriate Laplace-Gauss normal distribution, favoured by many academic textbooks and old regulations, has led to a systematic under-evaluation of the risk and can explain many market crashes in the last 50 years. It is my deep belief that the use of a more suitable model for fat-tailed distributions, like "K1", "K2", "K3" or "K4" models, will result in a better measure of the market risk and the corresponding capital required to cover it.
Videos
FatTailsR (version in development)
I am currently adding advanced plotting functions to FatTailsR to produce tailored images on stock value, return, logit and probability. The code has been applied on a 1 year rolling windows basis to Gold lingot and Euro-Dollar exchange rate from 1999 up to end 2013. Images produced by FatTailsR were then encoded into short videos. Check that tails are perfectly described. Click on the image to watch the videos. You need a modern browser that can display videos in any of the ogg/webm/mp4 formats.
Gold from 01/01/1999 to 31/12/2013.
Download the file in
mp4,
webm,
ogg,
flv format
and view it with a dedicated program.
Euro-USDollar excahnge rate from 01/01/1999 to 31/12/2013.
Download the file in
mp4,
webm,
ogg,
flv format
and view it with a dedicated program.
Bitcoin-Euro exchange rate from 20/09/2017 to 15/02/2018 aggregated by 24 hours x 9 days = 216 values.
Download the file in
mp4 format
and view it with a dedicated program.
Consulting services
More on Kiener distributions
If you wish to know more about these new functions and distributions, or have some special software requirements, in R or in other languages, please contact me. Consulting services are possible, worldwide.
A rare moment
Philosophy in finance
One week after the 8th R/Rmetrics workshop, I attended a SoFiE conference at Banque de France on "Systemic Risk and Financial Regulation". Program is
here and presentations are
here.
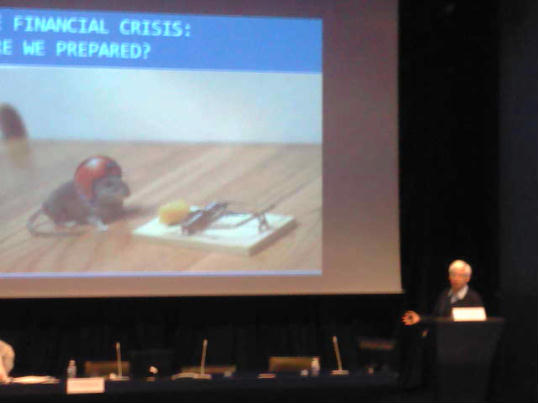
The last speaker was Robert Engle, 2003 Nobel prize in Economy (or more precisely the Swedish Central Bank Prize in Economic Sciences in Memory of Alfred Nobel) who talked about his last model and his work on "Structural GARCH: The Volatility-Leverage Connection".
At one point, he presented a slide whose title is : "Financial crisis : Are we prepared ?".
"In finance", he explained to the audience, "the most important is the helmet".